The Roles of AI in System Mapping processes
AI meets System Mapping Series #2
System mapping is fundamentally about making sense of complexity, surfacing relationships, identifying leverage points, and building shared understanding across diverse stakeholders. But it's also quite labour-intensive. Teams spend days hunting for relevant research, wrestling with competing framings, and struggling to communicate what they've discovered back to the organisation.
We have been experimenting with AI as a collaborative partner, exploring where it can strengthen analysis, enhance storytelling, and ultimately save time in the process. We’ve learned that AI doesn't have one single role in system mapping; it can have several, each suited to a different moment in the process. Some roles compress time (research, sketching), others shift perspective (seeing through stakeholder eyes, hearing critical questions), and still others make the invisible visible (turning abstract maps into stories that stick).
Here are the five roles of AI in system mapping we’ve identified
in our experiments so far:
1. The Knowledge Aggregator
Useful for quickly building a solid knowledge base at the start of a mapping process, drawing on existing research, frameworks, and documented perspectives. Saves the team significant time on summarizing desk research and ensures the work begins from the richest possible foundation.
TOOL USED IN EXPERIMENTS:
Notebook LM
Role in action
At the beginning of any mapping project, we’re often drowning in research. Case studies, policy documents, academic papers, video interviews, stakeholder reports, it all piles up, and somehow we have to make sense of it.
That's where we started using NotebookLM as a Knowledge Aggregator. Instead of manually extracting variables and themes across dozens of documents, we uploaded everything, PDFs, links, videos, into a single searchable database.
Then we asked it targeted questions: What variables appear across these sources? Which stakeholders keep surfacing? What are the root causes being cited?
What made this powerful wasn't the speed (though compressing days of desk research into hours mattered), it was the verification. We had already done manual analysis of the data, pulling out what we thought were the key variables. NotebookLM became a sense-check: Did we miss anything? Are there patterns we overlooked?
Often, it confirmed what we had found. Sometimes, it surfaced a variable we dismissed or buried in our notes. That validation gave us more confidence that our foundation was solid.
A nice additional feature of NotebookLM is its ability to generate podcasts that summarize the most important points from the uploaded datasets. These podcasts also allow users to interact with the panelists, ask questions, and explore topics in greater depth, all based on the data provided in the knowledge database.
2. The Kick-Starter

Useful for generating an initial draft map of dynamics and relationships, giving the group something tangible to engage with from the very first session. Transforms a blank page into a starting point, not a finished product, but a provocation that activates thinking and discussion.
TOOL USED IN EXPERIMENTS:
Systemic
Role in action
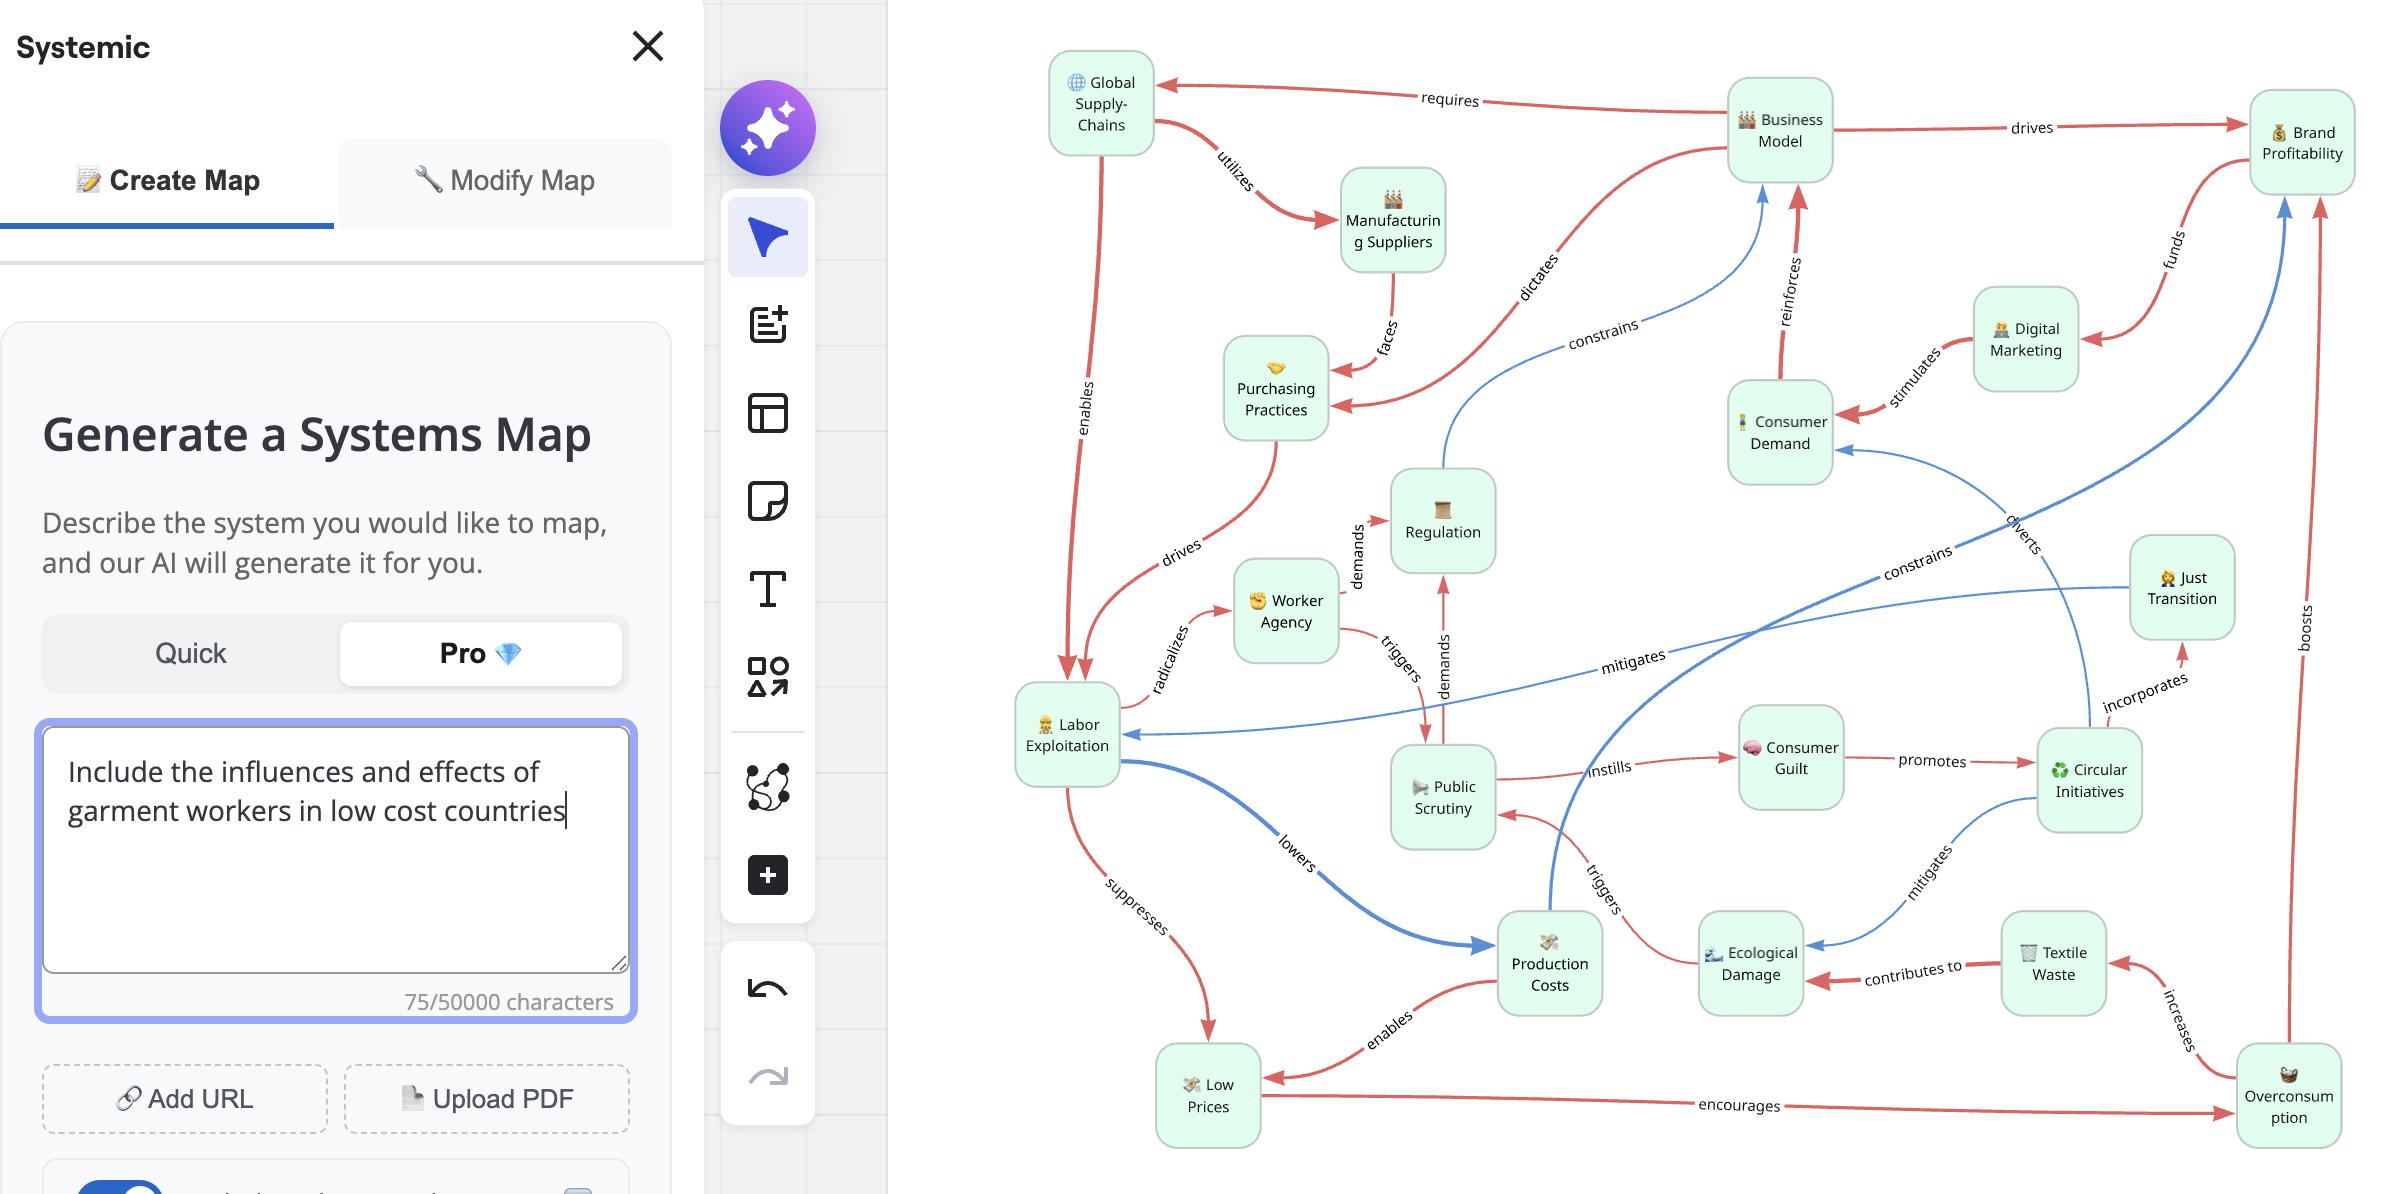
Early in the mapping process, you're facing a blank page. You have research, you have questions, but you don't yet have a map, no nodes, no connections, no visual shape to react to. That can be paralyzing.
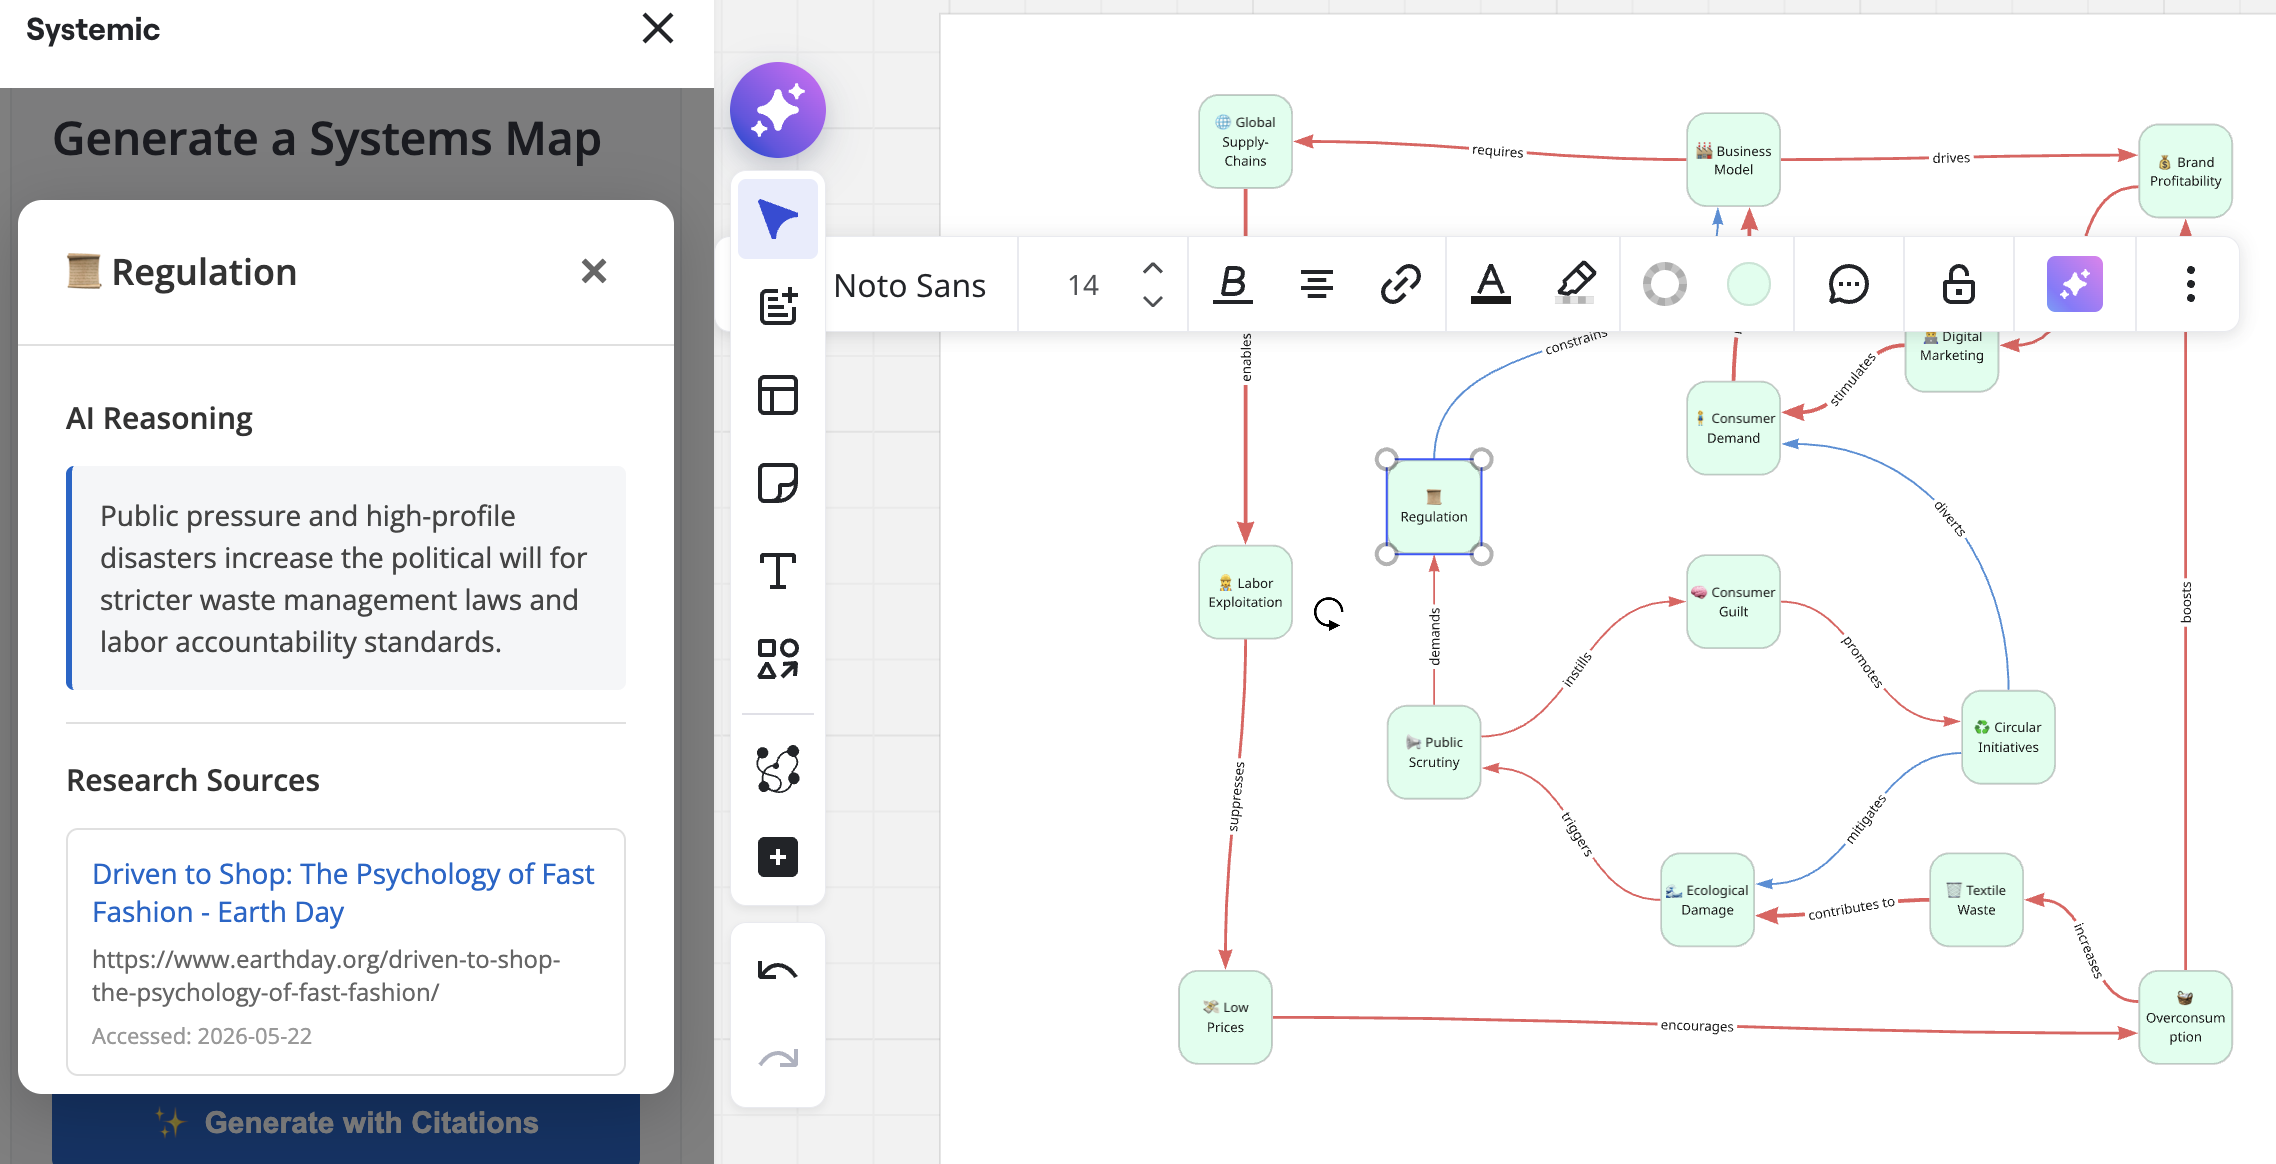
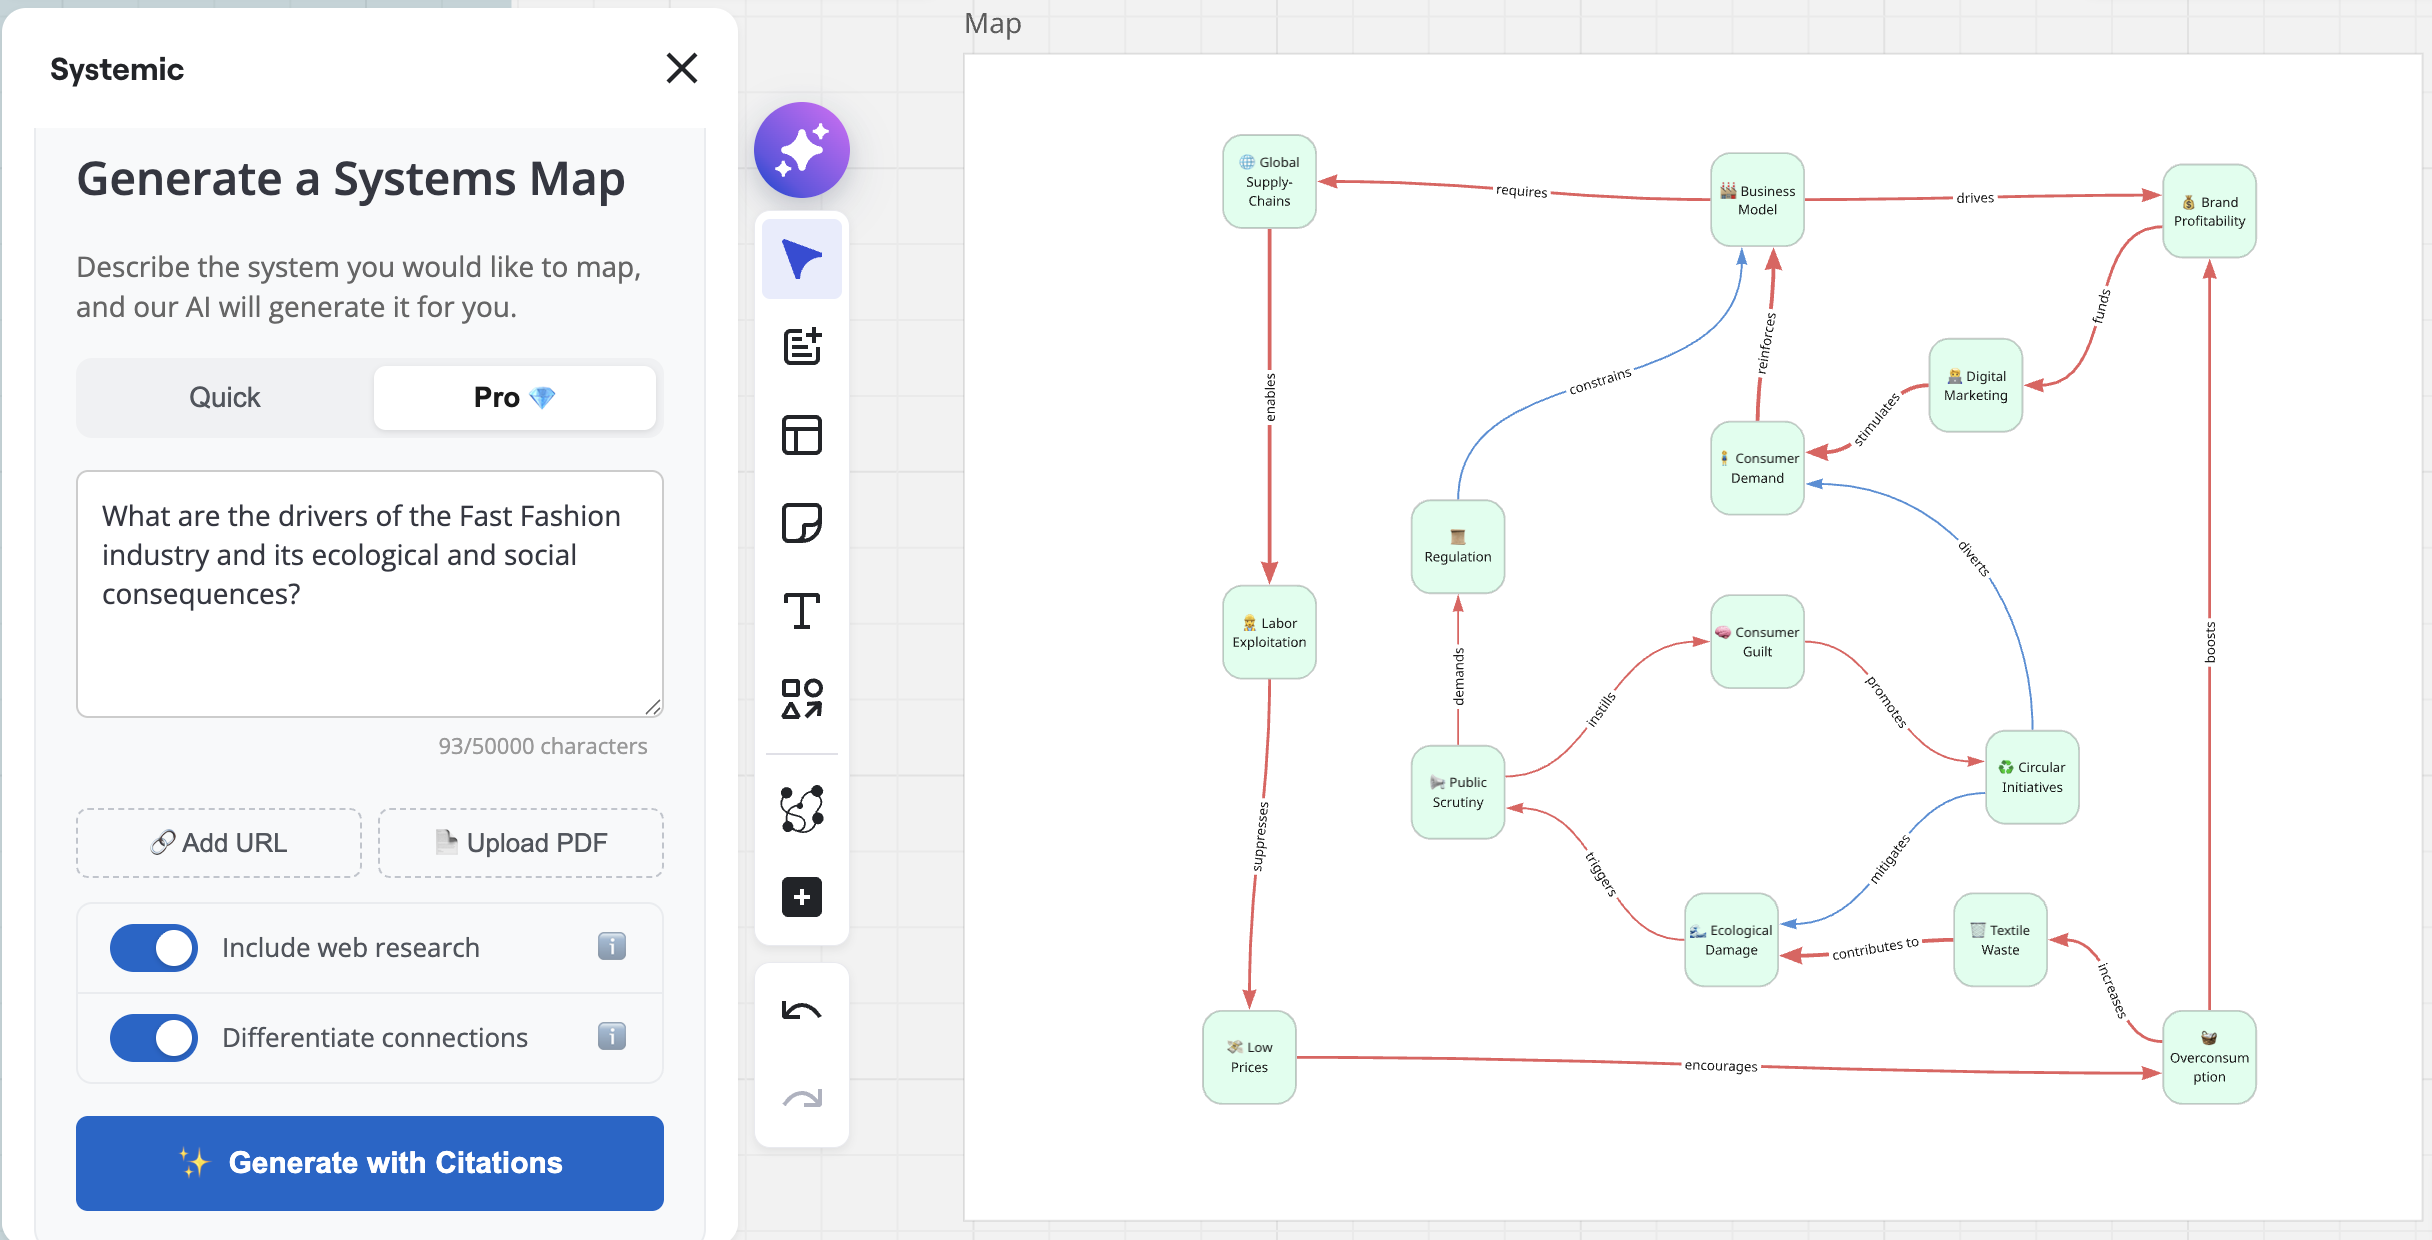
We used the Miro plugin Systemic to overcome that moment. With a simple prompt outlining the research question and including key documents, it generated an initial systems map. Within seconds, we had a draft — not polished or final, but a much more tangible starting point. Suddenly, there was something concrete to react to and build upon. We immediately began analyzing and questioning the draft: Why is this variable connected to that one? What is missing? We integrated our own research findings, tested the AI’s logic against what we already knew, and refined the map further.
From our perspective, the main benefit of tools that generate system maps with a single click is the ability to immediately engage with a draft and begin reflecting on it. Having a first version available within seconds creates a valuable opportunity: relationships and patterns can quickly be visualized for clients, used as conversation starters, or serve as summaries of complex research papers.
At the same time, this is where risk emerges. Tools like these can create the illusion that the problem has already been solved. You click “generate system map,” and suddenly a polished-looking result appears. That can be highly seductive. However, the real learning does not come from the output itself, it comes from the process of engaging with it, questioning it, testing assumptions, and reshaping the map based on your own understanding. If that step is skipped, you are left with a map you neither fully understand nor can confidently defend.
3. The Perspective-Shifter
Useful for deepening the team's understanding of how different stakeholders' experiences can look like. Brings greater empathy and perspective diversity into the analysis by systematically surfacing the interests, fears, and motivations that shape how actors behave.
TOOL USED IN EXPERIMENTS:
Claude
Role in action
A well-constructed system map can still feel flat. You have the dynamics mapped, the feedback loops drawn, the leverage points identified. But you're missing something crucial: the human behavior underneath. Why does this actor behave this way? What are they afraid of? What do they actually want?
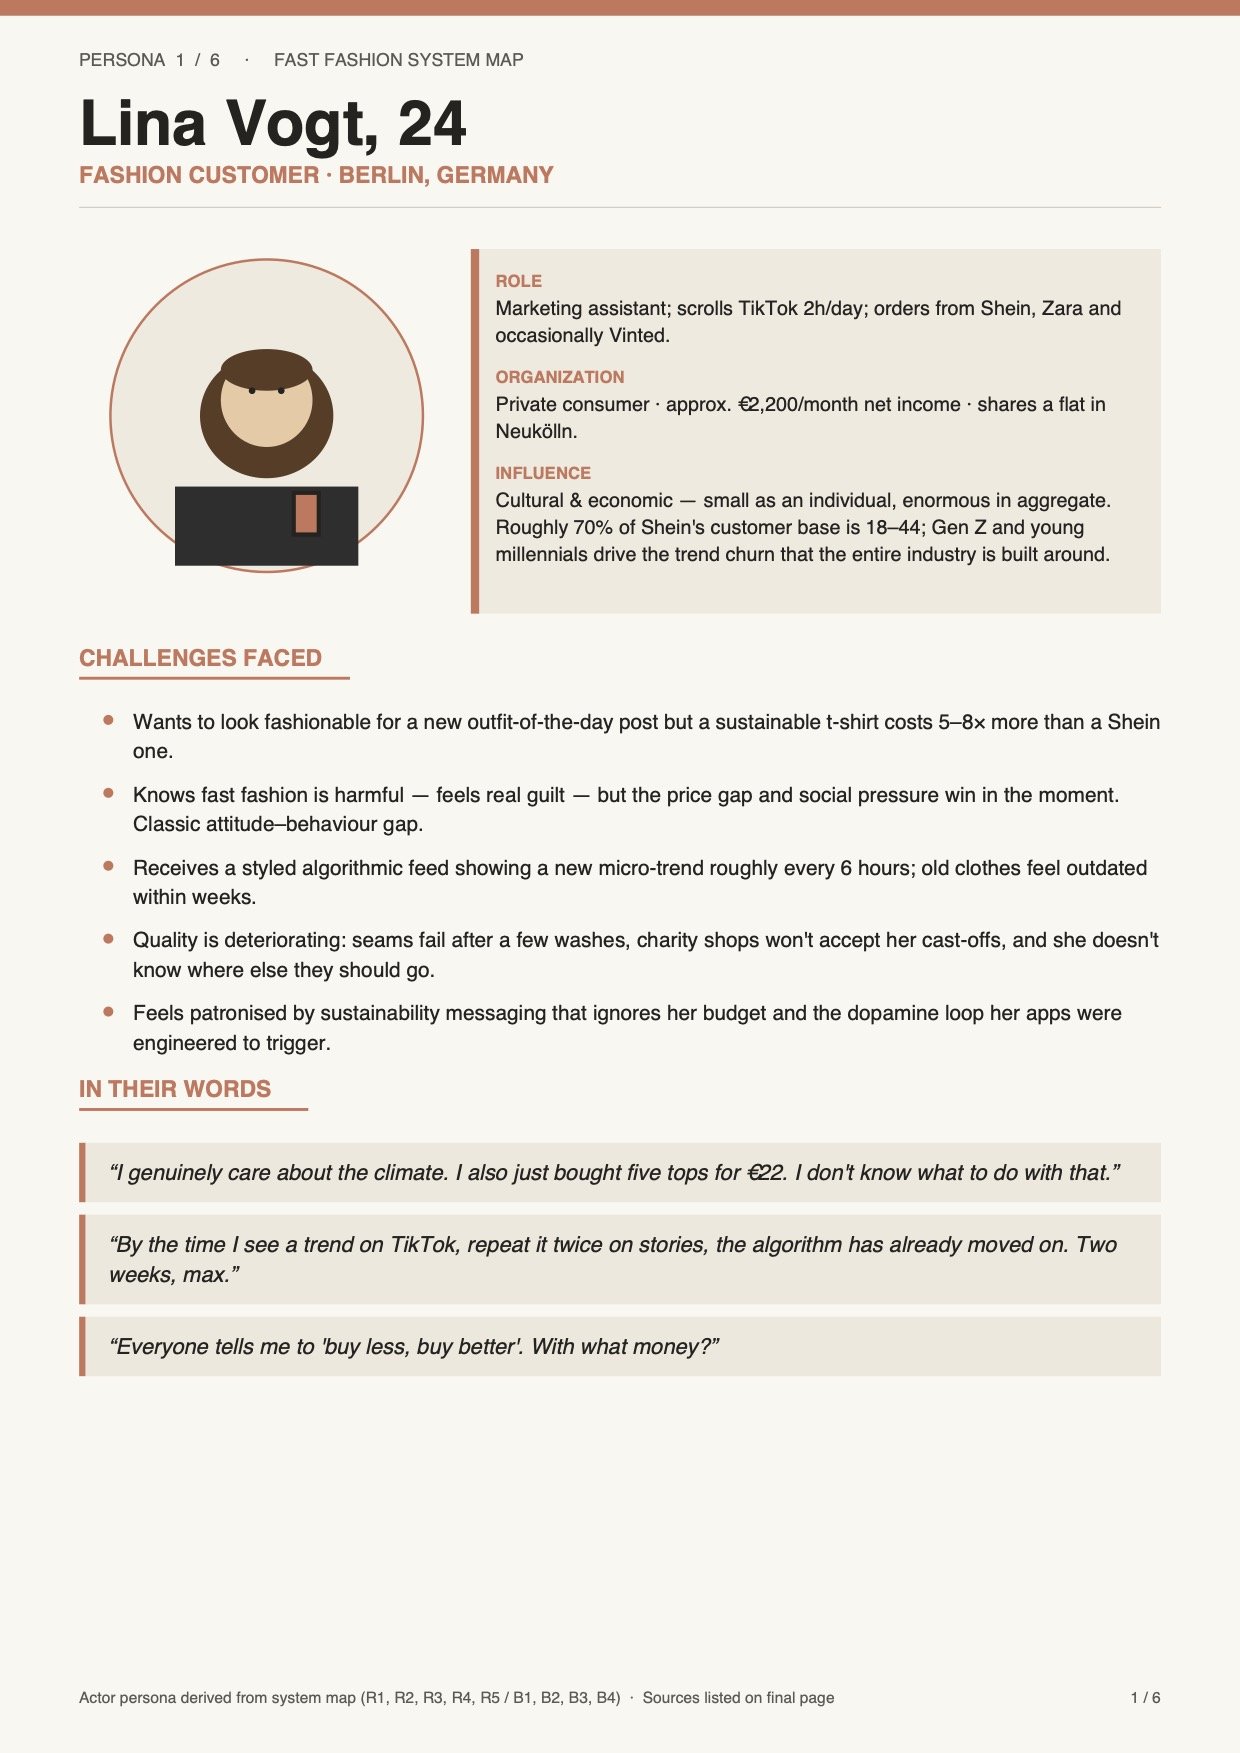
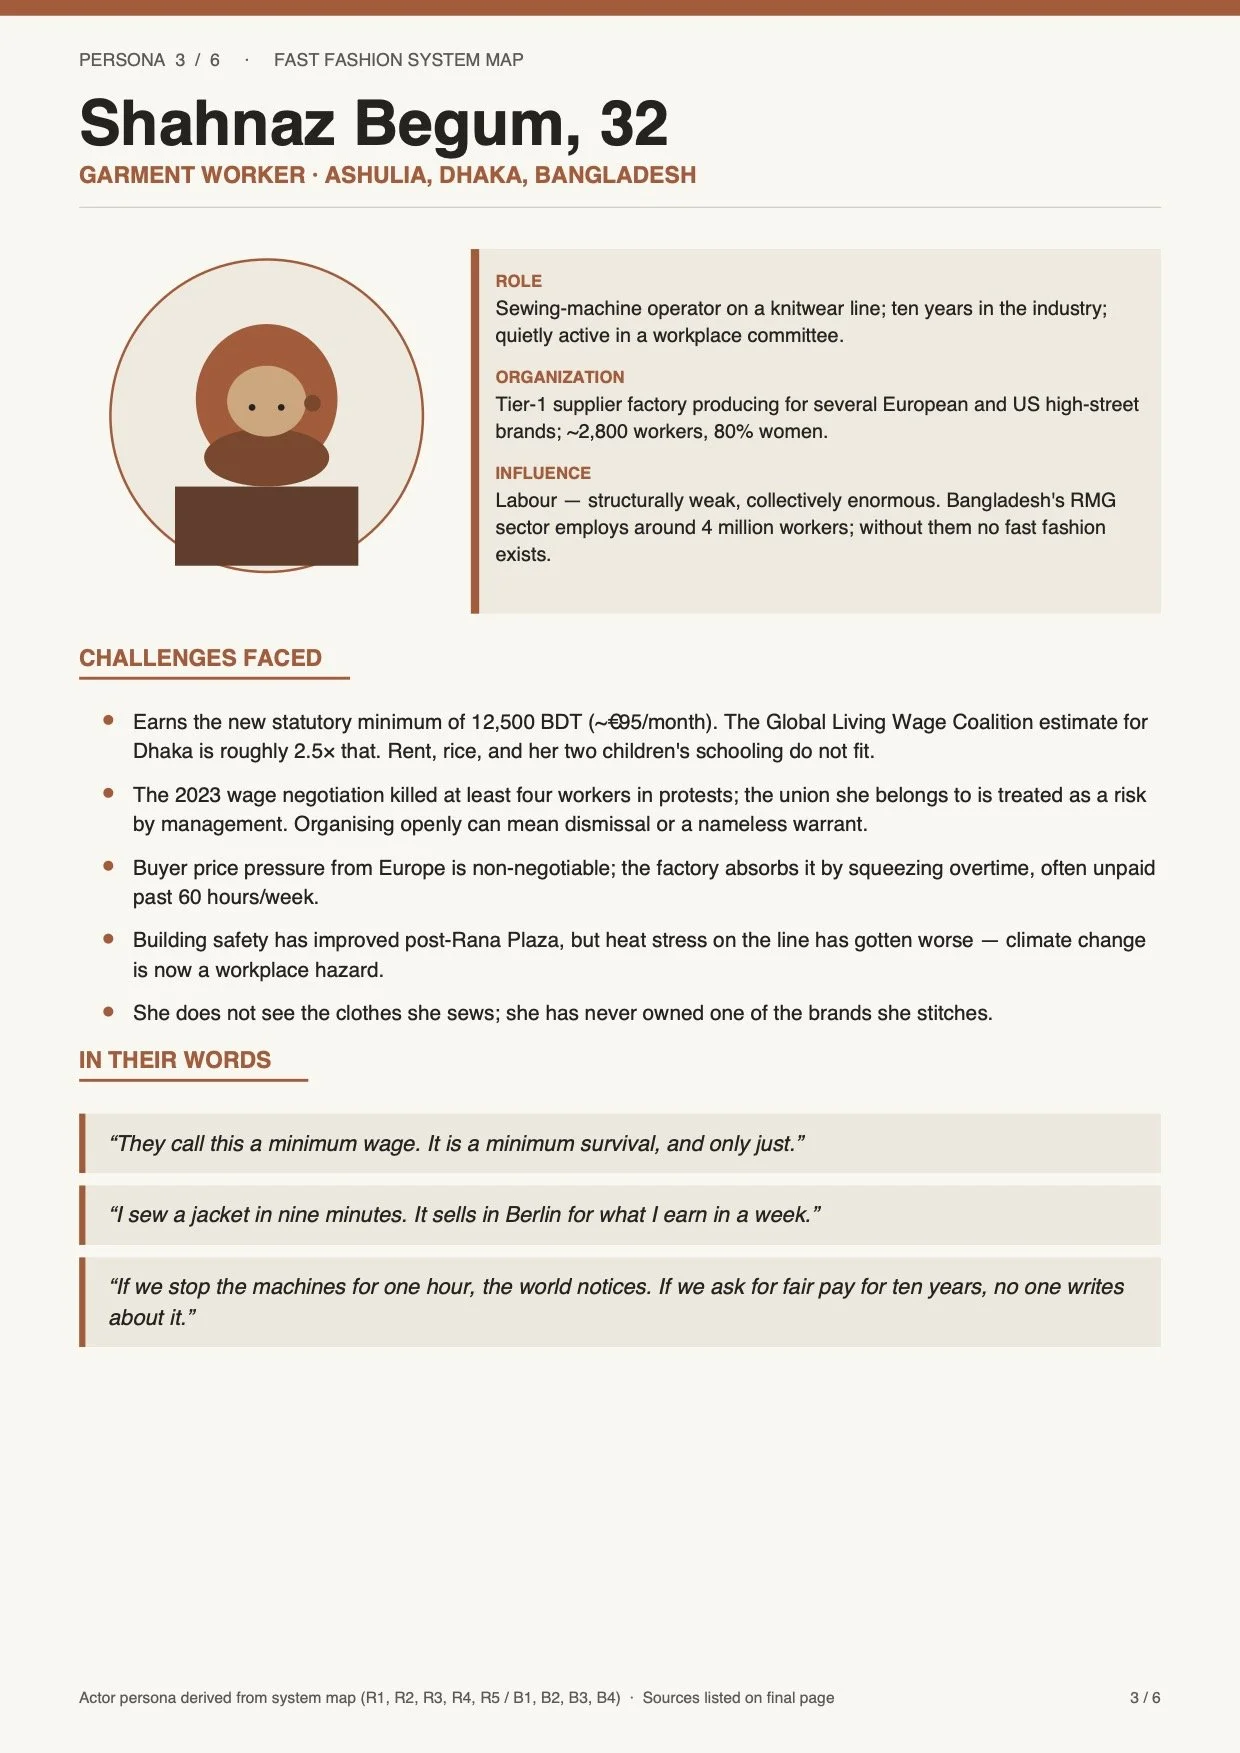
We used Claude as a Perspective-Shifter by asking it to build personas for key stakeholders, detailed profiles that included their challenges, their needs, and their worldview. Claude generated personas complete with sample quotes and statements. Suddenly, the e.g. customer in the system had a face and a voice. The policymaker had fears we hadn't articulated.
These personas shifted how the team understood the system dynamics. Instead of viewing actors as abstract roles, we could empathise with them a bit more. And that empathy opened up blind spots in our map. We realised we'd been thinking about incentives from a narrow perspective, or we'd missed a whole stakeholder group whose interests mattered. The personas didn't just illustrate the map, they challenged it.
But here's the risk: Claude doesn't tell you where it sourced those personas. It's drawing on patterns in its training data, making invisible choices about what matters and how to frame it. The personas I received were quite high-level, and when I dug into them, I could see subtle biases. Some felt filtered through a Western, capitalistic lens. Others were one-dimensional. You can't rely on AI personas as ground truth. You have to treat them as working hypotheses, bring them to your team, test them against real stakeholder data, and adapt them during the .
The moment I stopped treating the personas as "outputs" and started treating them as "drafts to be improved," they became valuable. They gave the team a language for discussing stakeholder perspectives, and that language led to richer conversations.
4.The Critical Thinking Companion

This role engages in open-ended dialogue about the challenge or system to help surface blind spots, test emerging hypotheses, and open up new angles of inquiry. Less a tool, more a sounding board, useful precisely when the team is not yet sure what question it is trying to answer.
TOOL USED IN EXPERIMENTS:
Claude
Role in action
Here's a phase in every mapping project where you're uncertain. Maybe your research question isn't quite right. Maybe you're seeing a pattern in the system, but you're not sure if it's real or an artefact of how you've framed the data. Maybe you're stuck, you know something is wrong, but you can't articulate what.
That's when I used Claude as a Critical Thinking Companion. Not to generate answers, but to help me think out loud. I'd describe what I was seeing, and Claude would ask: Have you considered this angle? What if you're wrong about that assumption? What would it mean if X were true instead?
I'll be honest: it took me a while to get used to having a critical partner that didn't know me and couldn't read the room. Sometimes Claude's pushback missed the mark, or took me down a path that wasn't useful. But even when it was off-base, the act of responding, of saying "no, that's not it, because...", forced me to clarify my own thinking. And often, it sparked new discussions in the team that wouldn't have happened otherwise.
The risk here is subtler. Claude might not fully grasp the context of your system. It might push you toward angles that sound plausible but don't fit your reality. You have to stay the driver. But if you're willing to stay engaged and treat the pushback as a mirror rather than gospel, it works. You feed it context as you go deeper into the system, you challenge it when it misses the mark, and you let it be a tool for reflection rather than a source of truth.
5.The Storyteller

Useful for translating complex maps and dynamics into narratives that are easier to understand, share, and act on. Helps teams communicate system insights beyond the mapping room, making the work accessible to wider audiences and building shared meaning across different groups.
TOOL USED IN EXPERIMENTS:
Synthesia, Self-developed Web-App
Role in action
You've mapped the system. You understand the dynamics, the stakeholders, the feedback loops. Now you have to communicate it to people who weren't in the room, who don't have your context, and who are busy. This often can be a challenge.
To address this, we built a web-based AI-mapping tool, (vibe) coding it ourselves, capable of generating system maps, summarising the system story, and reading it aloud. The results were striking, particularly when the visual and audio elements came together. These early outputs demonstrate how powerfully AI tools can support storytelling and lower the barrier to engaging with complex topics.
A further experiment used AI in two ways. First, we drafted system stories, narrative descriptions of how the system works, told through the experiences of key stakeholders. We wrote these ourselves, grounded in our map and research, but we used AI to polish them, tighten the language, and surface the storytelling. Then we took those polished stories and fed them into Synthesia, a tool that generates video narration with AI avatars. The result was striking: a farmer avatar, built from one of our personas, narrating his experience in an agricultural system. Not a real person, but a visualised representation of a real perspective. The story brought the system to life in a way the map alone never could. People remembered it. They could retell it. It became the shared reference point for conversations about the system.
But this comes with real responsibility. Translating a complex system into a story means necessarily simplifying it choosing which threads to follow, which details to foreground, and which to leave out. When an AI persona is added to that narrative, the risk deepens: audiences may begin to experience the construct as reality rather than as a representation of it. We must therefore be deliberate and transparent in how we use these approaches, and where we do use them, make that clearly visible to the audience.
These five roles are by no means exhaustive. As we continue working with AI in system mapping projects, we will discover new ways it can contribute, some predictable, others surprising. The potential is real, and so are the benefits, as long as we stay critical and intentional in how we use it.
What we need to watch out for is a quiet but familiar trap: the more convenient a tool is, the easier it becomes to rely on it without really thinking. AI is at its most valuable when it sharpens our thinking, not when it replaces it. The moment we stop questioning its outputs, we are no longer doing system analysis. We are just processing it.